TC
The Comparator

RTX 4090 vs RTX 5090 — value comparison

Product A
AD102

RTX 4090

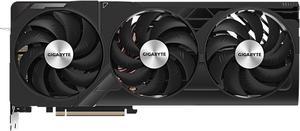
Representative tracked offer: NVIDIA GeForce RTX 4090 Founders Edition
24GB VRAMPerf: 1962450W
Current dataset offer · New$3699snapshot 2026-08-23
Relative Value
Go to offer · Newegg →
Price data · US · USD · New · A 2026-08-23 · B 2026-08-23Coverage · 13 tracked new-offer records across both modelsBenchmark confidence · no estimate flags on these two recordsAffiliate links · We may earn a commission from these links. Scores are calculated separately using our methodology.
Checking today's prices… This shared scoring frame includes an offer with a 24-hour freshness window, so price-derived results finish loading in your browser a moment from now. Capability, performance and verified specifications are already final.
02 · Decision matrix

One decision, three separate questions

Capability ignores price. Relative Value adds the current dataset offers and your priorities. Keeping them separate prevents a cheap product from being mistaken for the faster product.

Capability by task

Capability by task: RTX 4090 versus RTX 5090
ScenarioRTX 4090RTX 5090
1080p GamingS#2S#1
1440p GamingS#2S#1
4K / VRS#2S#1
Ray Tracing @ 2K (1440p)A#2S#1
AI / Local LLMS#2S#1
3D RenderingS#2S#1
Light Use & EfficiencyD#47D#48

RTX 5090 grades higher in 1 of 7 graded scenarios (6 tied) and is never graded lower. These are the same S–F grades as the tier list — capability only, price excluded. The value rows below add prices from the 2026-08-23 offer frame. How tiers are assigned →

Crossover price is loading. The switch-over point and Strong Value threshold appear as soon as today's offer snapshots are confirmed in your browser.
04 · Capability

Capability indexes, side by side

Price is intentionally excluded here so the more capable product and the better-value product cannot be confused.

Raster performance 1962
2383
Ray tracing 2037
2621
AI (FP16 tensor) 2833
3593
A · RTX 4090B · RTX 5090GPU indexes share one 1000-point scale (RTX 4070 = 1000).
05 · Platform & ownership

Fit, compatibility and ownership context

Only verified structured fields are shown. Physical fit, connectors, cooling and typical warranty belong to the representative tracked partner card named in each column; other board variants can differ.

A · RTX 4090

  • Representative offer variantNVIDIA GeForce RTX 4090 Founders Edition
  • Host interfacePCIe 4.0 x16
  • Suggested PSU850 W
  • Power connectors1x 16-pin
  • Card length304 mm
  • Expansion slots3-slot
  • Coolingair
  • Display outputs1× HDMI · 3× DisplayPort

B · RTX 5090

  • Representative offer variantASUS TUF Gaming RTX 5090
  • Host interfacePCIe 5.0 x16
  • Suggested PSU950 W
  • Power connectors1x 16-pin
  • Card length348 mm
  • Expansion slots4-slot
  • Coolingair
  • Display outputs2× HDMI · 3× DisplayPort
  • Warranty (typical new)36 mo
3-year electricity model

Over 3 years at 4h/day and $0.15/kWh, RTX 4090 (450 W) adds about $148 in modeled electricity and RTX 5090 (575 W) about $189. The modeled difference is roughly $41. This uses rated power as a common comparison input, not a promise of wall-power consumption.

06 · Specifications

Key specifications

Reference-GPU fields and representative-offer fields are labelled separately. Directional checkmarks appear only where more or less has a clear meaning; they are not an overall verdict.

Key specifications: RTX 4090 versus RTX 5090
SpecificationRTX 4090RTX 5090
ArchitectureAda LovelaceBlackwell 2.0
VRAM24 GB32 GB
Memory typeGDDR6XGDDR7
Memory bus384-bit512-bit
Host interfacePCIe 4.0 x16PCIe 5.0 x16
Boost clock2,520 MHz2,407 MHz
Board power (lower is better)450 W575 W
Suggested PSU (representative offer)850 W950 W
Power connectors (representative offer)1x 16-pin1x 16-pin
Card length (representative offer)304 mm348 mm
Warranty (representative offer)not tracked36 mo
Current dataset offer · New$3699snapshot 2026-08-23$4400snapshot 2026-08-23
Show additional verified specifications
Additional verified specifications: RTX 4090 versus RTX 5090
SpecificationRTX 4090RTX 5090
Process node5 nm5 nm
Base clock2,235 MHz2,017 MHz
Memory data rate21 Gbps28 Gbps
Expansion slots (representative offer)3-slot4-slot
Cooling fans (representative offer)33
Display outputs (representative offer)1× HDMI · 3× DisplayPort2× HDMI · 3× DisplayPort
Cooling type (representative offer)airair

“Not tracked” means the source data does not contain a verified value; no default or guessed specification is substituted.

07 · Customize

Try other models and your own priorities

Presets are starting points. Swap either side, then open Advanced weights only if you want to tune the formula directly.

08 · Alternative

A third option worth checking

The same scenario and market frame checks whether another currently priced model offers a cleaner trade-off.

A price-aware third suggestion appears once today's offer snapshots are confirmed in your browser.
09 · Decision guide

Choose based on the trade-off you actually want

These are evidence-linked conditions, not universal buying verdicts. Feature ecosystems, software support and platform preferences remain your call.

Choose A · RTX 4090 if…

  • Lower rated power matters: 450 W versus 575 W for RTX 5090.
Full RTX 4090 analysis →

Choose B · RTX 5090 if…

  • You prioritize Ray Tracing — it earns the higher capability tier in those tracked scenarios.
Full RTX 5090 analysis →
10 · Methodology & FAQ

How to read this comparison

The formula is a linear weighted sum inside the current comparison frame. Capability, price and user priorities stay visible as separate inputs so the result can be challenged and changed.

Read the methodology →
Which one is more capable, ignoring price?
RTX 5090 grades higher in 1 of 7 graded scenarios (6 tied) and is never graded lower.
Where can I compare current offers for both?
Dated offer snapshots for both models are listed on their product pages (linked above); the interactive calculator recalculates both with your own weights and budget.

Offer frame: 2026-08-23 · dataset generated 2026-08-23 · formula gpu-value-v1.4-benefit-cost-product · Value Score is an estimate based on our current dataset, selected weights, market prices and methodology — not an official product rating or a price forecast. Target prices are calculation thresholds, not predictions. Methodology · Report a data error