TC
The Comparator

RTX 4070 Super vs RTX 4070 Ti โ€” value comparison

Product B
AD104

RTX 4070 Ti

Representative tracked offer: MSI GeForce RTX 4070 Ti GAMING X TRIO 12G
12GB VRAMPerf: 1210285W
Current dataset offer ยท New$1001snapshot 2026-08-24
Relative Value
Go to offer ยท Newegg โ†’
Price data ยท US ยท USD ยท New ยท A 2026-08-24 ยท B 2026-08-24Coverage ยท 11 tracked new-offer records across both modelsBenchmark confidence ยท no estimate flags on these two recordsAffiliate links ยท We may earn a commission from these links. Scores are calculated separately using our methodology.
Checking today's pricesโ€ฆ This shared scoring frame includes an offer with a 24-hour freshness window, so price-derived results finish loading in your browser a moment from now. Capability, performance and verified specifications are already final.
02 ยท Decision matrix

One decision, three separate questions

Capability ignores price. Relative Value adds the current dataset offers and your priorities. Keeping them separate prevents a cheap product from being mistaken for the faster product.

Capability by task

Capability by task: RTX 4070 Super versus RTX 4070 Ti
ScenarioRTX 4070 SuperRTX 4070 Ti
1080p GamingS#17S#14
1440p GamingA#17A#14
4K / VRB#17B#14
Ray Tracing @ 2K (1440p)C#16B#9โœ“
AI / Local LLMB#12B#11
3D RenderingB#12A#7โœ“
Light Use & EfficiencyC#33C#44

RTX 4070 Ti grades higher in 2 of 7 graded scenarios (5 tied) and is never graded lower. These are the same Sโ€“F grades as the tier list โ€” capability only, price excluded. The value rows below add prices from the 2026-08-24 offer frame. How tiers are assigned โ†’

Crossover price is loading. The switch-over point and Strong Value threshold appear as soon as today's offer snapshots are confirmed in your browser.
04 ยท Capability

Capability indexes, side by side

Price is intentionally excluded here so the more capable product and the better-value product cannot be confused.

Raster performance 1160
1210
Ray tracing 1167
1279
AI (FP16 tensor) 1217
1376
A ยท RTX 4070 SuperB ยท RTX 4070 TiGPU indexes share one 1000-point scale (RTX 4070 = 1000).
05 ยท Platform & ownership

Fit, compatibility and ownership context

Only verified structured fields are shown. Physical fit, connectors, cooling and typical warranty belong to the representative tracked partner card named in each column; other board variants can differ.

A ยท RTX 4070 Super

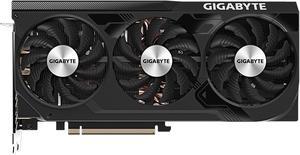
  • Representative offer variantGIGABYTE RTX 4070 SUPER WINDFORCE OC
  • Host interfacePCIe 4.0 x16
  • Suggested PSU550 W
  • Power connectors1x 16-pin
  • Card length261 mm
  • Expansion slots2-slot
  • Coolingair
  • Display outputs1ร— HDMI ยท 3ร— DisplayPort
  • Warranty (typical new)36 mo

B ยท RTX 4070 Ti

  • Representative offer variantMSI GeForce RTX 4070 Ti GAMING X TRIO 12G
  • Host interfacePCIe 4.0 x16
  • Suggested PSU600 W
  • Power connectors1x 16-pin
  • Card length285 mm
  • Expansion slots2-slot
  • Coolingair
  • Display outputs1ร— HDMI ยท 3ร— DisplayPort
  • Warranty (typical new)36 mo
3-year electricity model

Over 3 years at 4h/day and $0.15/kWh, RTX 4070 Super (220 W) adds about $72 in modeled electricity and RTX 4070 Ti (285 W) about $94. The modeled difference is roughly $22. This uses rated power as a common comparison input, not a promise of wall-power consumption.

06 ยท Specifications

Key specifications

Reference-GPU fields and representative-offer fields are labelled separately. Directional checkmarks appear only where more or less has a clear meaning; they are not an overall verdict.

Key specifications: RTX 4070 Super versus RTX 4070 Ti
SpecificationRTX 4070 SuperRTX 4070 Ti
ArchitectureAda LovelaceAda Lovelace
VRAM12 GB12 GB
Memory typeGDDR6XGDDR6X
Memory bus192-bit192-bit
Host interfacePCIe 4.0 x16PCIe 4.0 x16
Boost clock2,505 MHz2,610 MHz
Board power (lower is better)220 Wโœ“285 W
Suggested PSU (representative offer)550 W600 W
Power connectors (representative offer)1x 16-pin1x 16-pin
Card length (representative offer)261 mmโœ“285 mm
Warranty (representative offer)36 mo36 mo
Current dataset offer ยท New$812snapshot 2026-08-24โœ“$1001snapshot 2026-08-24
Show additional verified specifications
Additional verified specifications: RTX 4070 Super versus RTX 4070 Ti
SpecificationRTX 4070 SuperRTX 4070 Ti
Process node5 nm5 nm
Base clock1,980 MHz2,310 MHz
Memory data rate21 Gbps21 Gbps
Expansion slots (representative offer)2-slot2-slot
Cooling fans (representative offer)23
Display outputs (representative offer)1ร— HDMI ยท 3ร— DisplayPort1ร— HDMI ยท 3ร— DisplayPort
Cooling type (representative offer)airair

โ€œNot trackedโ€ means the source data does not contain a verified value; no default or guessed specification is substituted.

07 ยท Customize

Try other models and your own priorities

Presets are starting points. Swap either side, then open Advanced weights only if you want to tune the formula directly.

08 ยท Alternative

A third option worth checking

The same scenario and market frame checks whether another currently priced model offers a cleaner trade-off.

A price-aware third suggestion appears once today's offer snapshots are confirmed in your browser.
09 ยท Decision guide

Choose based on the trade-off you actually want

These are evidence-linked conditions, not universal buying verdicts. Feature ecosystems, software support and platform preferences remain your call.

Choose A ยท RTX 4070 Super ifโ€ฆ

  • Lower rated power matters: 220 W versus 285 W for RTX 4070 Ti.
Full RTX 4070 Super analysis โ†’

Choose B ยท RTX 4070 Ti ifโ€ฆ

  • You prioritize Ray Tracing, 3D Rendering โ€” it earns the higher capability tier in those tracked scenarios.
Full RTX 4070 Ti analysis โ†’
10 ยท Methodology & FAQ

How to read this comparison

The formula is a linear weighted sum inside the current comparison frame. Capability, price and user priorities stay visible as separate inputs so the result can be challenged and changed.

Read the methodology โ†’
Which one is more capable, ignoring price?
RTX 4070 Ti grades higher in 2 of 7 graded scenarios (5 tied) and is never graded lower.
Where can I compare current offers for both?
Dated offer snapshots for both models are listed on their product pages (linked above); the interactive calculator recalculates both with your own weights and budget.

Offer frame: 2026-08-24 ยท dataset generated 2026-08-24 ยท formula gpu-value-v1.4-benefit-cost-product ยท Value Score is an estimate based on our current dataset, selected weights, market prices and methodology โ€” not an official product rating or a price forecast. Target prices are calculation thresholds, not predictions. Methodology ยท Report a data error