Relative Value46balanced preset
Capability ignores price. Relative Value adds the current dataset offers and your priorities. Keeping them separate prevents a cheap product from being mistaken for the faster product.
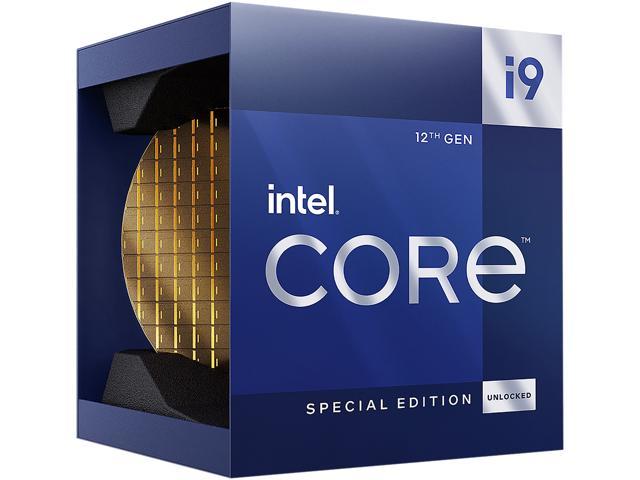
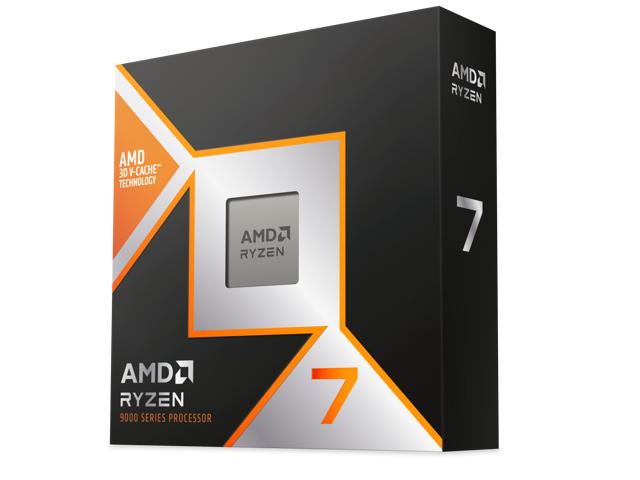
| Scenario | Intel Core i9-12900KS | AMD Ryzen 7 9800X3D |
|---|---|---|
| Gaming | A#52 | S#2✓ |
| Productivity | A#35✓ | B#43 |
| Performance per Watt | C#82 | B#46✓ |
AMD Ryzen 7 9800X3D grades higher in 2 scenarios, Intel Core i9-12900KS in 1 — the lead is not across the board, so check the row that matches your use. These are the same S–F grades as the tier list — capability only, price excluded. The value rows below add prices from the 2026-09-26–2026-09-27 offer frame. How tiers are assigned →
Both products are normalized within the same in-stock market frame per preset. A check marks the higher Relative Value; a difference of 3 points or less is shown as practically even.
Current offers, crossover points and Strong Value thresholds answer different questions. Thresholds are calculations, not price forecasts.
Dated New-condition price snapshots for only the two products in this comparison. Confirm the final price and availability at the store.
Price is intentionally excluded here so the more capable product and the better-value product cannot be confused.
Only verified structured fields are shown. Platform cost, cooler inclusion and upgrade-path claims are omitted when the dataset does not track them reliably.
Over 3 years at 4h/day and $0.15/kWh, Intel Core i9-12900KS (241 W) adds about $79 in modeled electricity and AMD Ryzen 7 9800X3D (162 W) about $53. The modeled difference is roughly $26. This uses rated power as a common comparison input, not a promise of wall-power consumption.
Directional checkmarks appear only on numeric fields where more or less has a clear meaning. They are not an overall verdict.
| Specification | Intel Core i9-12900KS | AMD Ryzen 7 9800X3D |
|---|---|---|
| Socket | LGA 1700 | AM5 |
| Architecture / codename | Alder Lake (Golden Cove / Gracemont) | Granite Ridge |
| Cores / threads | 16C / 24T✓ | 8C / 16T |
| Core layout | 8P + 8E | 8 homogeneous cores |
| Base clock | 3,400 MHz | 4,700 MHz |
| Boost clock | 5,500 MHz | 5,200 MHz |
| L3 cache | 30 MB | 96 MB✓ |
| Memory support | DDR5, DDR4 | DDR5 |
| Integrated graphics | Intel UHD Graphics 770 | AMD Radeon Graphics |
| Base power / TDP (lower is better) | 150 W | 120 W✓ |
| Process node | not tracked | 4 nm |
| Current dataset offer · New | $398snapshot 2026-09-27✓ | $469snapshot 2026-09-27 |
| Specification | Intel Core i9-12900KS | AMD Ryzen 7 9800X3D |
|---|---|---|
| L2 cache | 14 MB✓ | 8 MB |
| Maximum memory | 128 GB | 256 GB |
| ECC support | Yes | Yes |
| Unlocked multiplier | Yes | Yes |
| Maximum rated power | 241 W | 162 W✓ |
| Warranty (typical new) | 36 mo✓ | 24 mo |
“Not tracked” means the source data does not contain a verified value; no default or guessed specification is substituted.
Presets are starting points. Swap either side, then open Advanced weights only if you want to tune the formula directly.
The same scenario and market frame checks whether another currently priced model offers a cleaner trade-off.
The scenario-aware check did not find a currently priced alternative that improves this decision without changing the trade-off. This is a dataset result, not a claim that no other product exists.
These are evidence-linked conditions, not universal buying verdicts. Feature ecosystems, software support and platform preferences remain your call.
The formula is a linear weighted sum inside the current comparison frame. Capability, price and user priorities stay visible as separate inputs so the result can be challenged and changed.
Offer frame: 2026-09-26–2026-09-27 · dataset generated 2026-09-27 · formula cpu-value-v1.4-benefit-cost-product · Value Score is an estimate based on our current dataset, selected weights, market prices and methodology — not an official product rating or a price forecast. Target prices are calculation thresholds, not predictions. Methodology · Report a data error