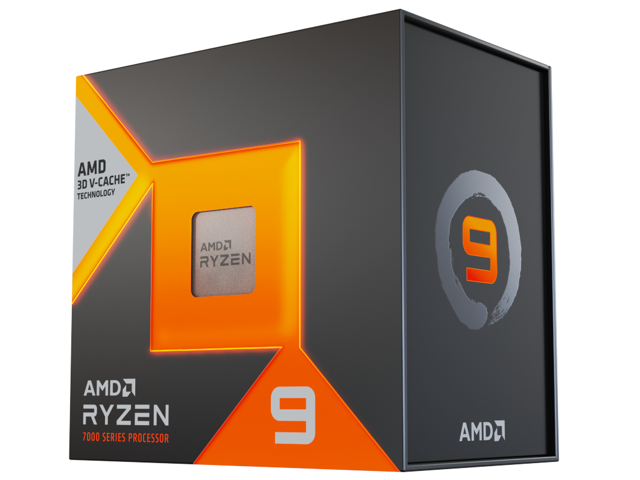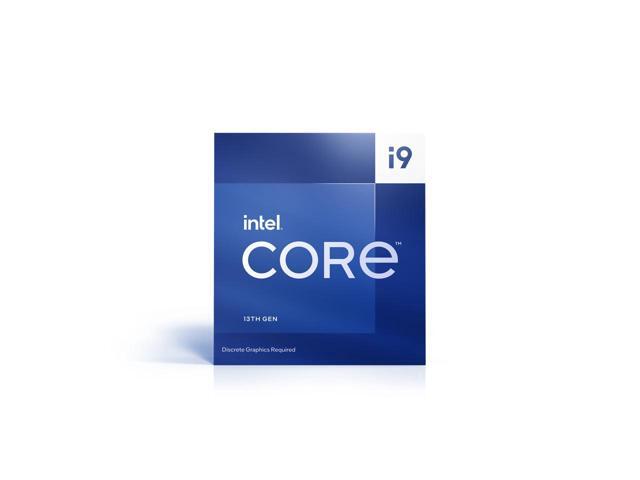
TC
The Comparator

Intel Core i9-13900 vs AMD Ryzen 9 7900X3D — value comparison

Intel Core i9-13900 and AMD Ryzen 9 7900X3D are practically even under balanced weights at the current dataset offers: 36 vs 33. Change the preset or your priorities before deciding.
Price data · Canada · CAD · New · A 2026-09-13 · B 2026-09-13Coverage · 2 tracked new-offer records across both modelsBenchmark confidence · includes identified estimates or reference inheritanceAffiliate links · We may earn a commission from these links. Scores are calculated separately using our methodology.
02 · Decision matrix

One decision, three separate questions

Capability ignores price. Relative Value adds the current dataset offers and your priorities. Keeping them separate prevents a cheap product from being mistaken for the faster product.

The decision, split by questioncapability · value · price are separate answers
CapabilityAMD Ryzen 9 7900X3D (2 of 3 scenarios)
Better value todayIntel Core i9-13900 — 3 more Value points under this configuration
Cheaper right nowIntel Core i9-13900 (by CAD 356)

Capability by task

Capability by task: Intel Core i9-13900 versus AMD Ryzen 9 7900X3D
ScenarioIntel Core i9-13900AMD Ryzen 9 7900X3D
GamingA#12S#5
ProductivityA#20A#14
Performance per WattC#41A#11

AMD Ryzen 9 7900X3D grades higher in 2 of 3 graded scenarios (1 tied) and is never graded lower. These are the same S–F grades as the tier list — capability only, price excluded. The value rows below add prices from the 2026-09-13 offer frame. How tiers are assigned →

Relative Value by priority

Balancedpractically even (≤3 pts)
36
33
Gaminghigher relative value lit
52
58 ✓
Productivityhigher relative value lit
44 ✓
34
Performance per Watthigher relative value lit
34
46 ✓
Strict Budgethigher relative value lit
20 ✓
16
Code Buildshigher relative value lit
41 ✓
32

Both products are normalized within the same in-stock market frame per preset. A check marks the higher Relative Value; a difference of 3 points or less is shown as practically even.

03 · Price crossover

The price changes the answer

Current offers, crossover points and Strong Value thresholds answer different questions. Thresholds are calculations, not price forecasts.

A · Intel Core i9-13900

Current dataset offer · NewCanada · CAD · snapshot 2026-09-13
CAD 1000
Beats AMD Ryzen 9 7900X3D atbalanced weights; rival offer held fixed
CAD 1130
Strong Value at80+ Relative Value threshold
CAD 318

B · AMD Ryzen 9 7900X3D

Current dataset offer · NewCanada · CAD · snapshot 2026-09-13
CAD 1356
Beats Intel Core i9-13900 atbalanced weights; rival offer held fixed
CAD 1199
Strong Value at80+ Relative Value threshold
CAD 381
04 · Where to buy

Current offers for both products

Dated New-condition price snapshots for only the two products in this comparison. Confirm the final price and availability at the store.

05 · Capability

Capability indexes, side by side

Price is intentionally excluded here so the more capable product and the better-value product cannot be confused.

Multi-thread 1262
1413
Single-thread 924
966
Gaming 1088
1247
A · Intel Core i9-13900B · AMD Ryzen 9 7900X3DEach row keeps the unit or category index named in its label; bar length compares A and B within that row.The Value leader depends on how you weight things: Intel Core i9-13900 leads under 3 presets, AMD Ryzen 9 7900X3D under 2, 1 practically even.
06 · Platform & ownership

Fit, compatibility and ownership context

Only verified structured fields are shown. Platform cost, cooler inclusion and upgrade-path claims are omitted when the dataset does not track them reliably.

A · Intel Core i9-13900

  • SocketLGA 1700
  • Memory supportDDR5, DDR4
  • Integrated graphicsIntel UHD Graphics 770
  • Rated base power65 W
  • Maximum rated power219 W
  • Warranty (typical new)36 mo

B · AMD Ryzen 9 7900X3D

  • SocketAM5
  • Memory supportDDR5
  • Integrated graphicsAMD Radeon Graphics
  • Rated base power120 W
  • Maximum rated power162 W
  • Measured all-core power120 W
  • Warranty (typical new)24 mo
3-year electricity model

Over 3 years at 4h/day and CAD 0.18/kWh, Intel Core i9-13900 (219 W) adds about CAD 86 in modeled electricity and AMD Ryzen 9 7900X3D (162 W) about CAD 64. The modeled difference is roughly CAD 22. This uses rated power as a common comparison input, not a promise of wall-power consumption.

07 · Specifications

Key specifications

Directional checkmarks appear only on numeric fields where more or less has a clear meaning. They are not an overall verdict.

Key specifications: Intel Core i9-13900 versus AMD Ryzen 9 7900X3D
SpecificationIntel Core i9-13900AMD Ryzen 9 7900X3D
SocketLGA 1700AM5
Architecture / codenameRaptor LakeRaphael
Cores / threads24C / 32T12C / 24T
Core layout8P + 16E12 homogeneous cores
Base clock2,000 MHz4,400 MHz
Boost clock5,600 MHz5,600 MHz
L3 cache36 MB128 MB
Memory supportDDR5, DDR4DDR5
Integrated graphicsIntel UHD Graphics 770AMD Radeon Graphics
Base power / TDP (lower is better)65 W120 W
Process nodenot tracked5 nm
Current dataset offer · NewCAD 1000snapshot 2026-09-13CAD 1356snapshot 2026-09-13
Show additional verified specifications
Additional verified specifications: Intel Core i9-13900 versus AMD Ryzen 9 7900X3D
SpecificationIntel Core i9-13900AMD Ryzen 9 7900X3D
L2 cache32 MB12 MB
Maximum memory192 GB128 GB
ECC supportYesYes
Unlocked multiplierNoYes
Maximum rated power219 W162 W
Warranty (typical new)36 mo24 mo

“Not tracked” means the source data does not contain a verified value; no default or guessed specification is substituted.

08 · Customize

Try other models and your own priorities

Presets are starting points. Swap either side, then open Advanced weights only if you want to tune the formula directly.

09 · Alternative

A third option worth checking

The same scenario and market frame checks whether another currently priced model offers a cleaner trade-off.

Worth considering instead
AMD Ryzen 7 9850X3D — same S-tier capability for Gaming, about CAD 320 cheaper · Value 100.
Neither of the two above is the only answer — this one clears the same bar for less. ⇄ Compare all three
10 · Decision guide

Choose based on the trade-off you actually want

These are evidence-linked conditions, not universal buying verdicts. Feature ecosystems, software support and platform preferences remain your call.

Choose A · Intel Core i9-13900 if…

  • Your priorities resemble Productivity, Strict Budget, Code Builds — it has higher Relative Value under those presets at the snapshot offers.
  • You can find it at or below its Strong Value threshold of CAD 318 under balanced weights.
Full Intel Core i9-13900 analysis →

Choose B · AMD Ryzen 9 7900X3D if…

  • You prioritize Gaming, Performance per Watt — it earns the higher capability tier in those tracked scenarios.
  • Your priorities resemble Gaming, Performance per Watt — it has higher Relative Value under those presets at the snapshot offers.
  • Lower rated power matters: 162 W versus 219 W for Intel Core i9-13900.
  • You can find it at or below its Strong Value threshold of CAD 381 under balanced weights.
Full AMD Ryzen 9 7900X3D analysis →
11 · Methodology & FAQ

How to read this comparison

The formula is a linear weighted sum inside the current comparison frame. Capability, price and user priorities stay visible as separate inputs so the result can be challenged and changed.

Read the methodology →
Which is better value right now: Intel Core i9-13900 or AMD Ryzen 9 7900X3D?
Under the balanced preset and the 2026-09-13 offer frame, they are practically even in Relative Value (36 vs 33). Change the preset or weights to reflect your own priorities; capability is a separate question, answered by the tier table.
Which one is more capable, ignoring price?
AMD Ryzen 9 7900X3D grades higher in 2 of 3 graded scenarios (1 tied) and is never graded lower.
Where can I compare current offers for both?
Dated offer snapshots for both models are listed on their product pages (linked above); the interactive calculator recalculates both with your own weights and budget.

Offer frame: 2026-09-13 · dataset generated 2026-09-14 · formula cpu-value-v1.4-benefit-cost-product · Value Score is an estimate based on our current dataset, selected weights, market prices and methodology — not an official product rating or a price forecast. Target prices are calculation thresholds, not predictions. Methodology · Report a data error